Description
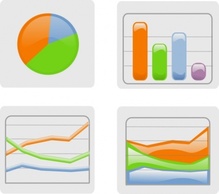
Three-dimensional pie chart with four sections with different sizes, heights and colors. Shiny red, yellow, blue and green sectors to represent different data in a survey. Colorful graph vector to illustrate survey results in science, statistic, learning and information design themes.